Watching Key Progress Information With Monitor
The Monitor feature in WebHub is similar to the stand-alone Monitor application that is part of the PatronBase system. This version runs within WebHub, and provides the options of a static tile and/or dynamic tiles on the WebHub home page. To start, click the static Monitor tile.
If the Monitor page has not been configured, you will be given the option to Create Widgets to start things off.

This will automatically create a set of widgets displaying some production and donation reports.

To clear the existing widgets and start over again, select Reset Monitor from the menu’s hamburger button.

Configure Tiles
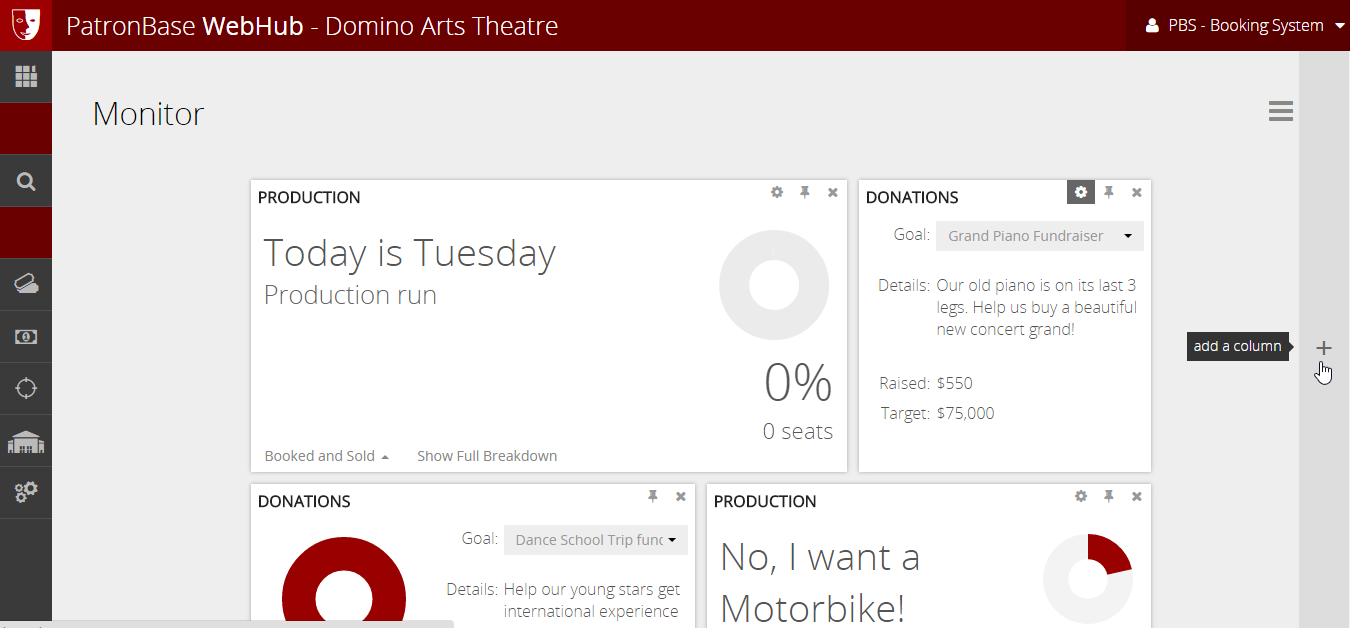
To configure a tile, click the Settings cog icon in the top left corner of the tile.

A Production tile will let you select from the available productions.

You also need to select which statistic to display - Performance, Production run to date, or Production run. If you select Performance, you will need to specify a particular performance, and for Production run to date, you will need to select either Today or a particular date.

Once saved, you can select some options from the tile itself. In the bottom-left corner of the tile a label identifies the current statistic being displayed. Click on this to choose from a list of statistics: Booked seats, Sold seats, Booked and Sold seats, Available seats and Held seats.

Click Show Full Breakdown to see a table that shows a breakdown of the sales by book type.

Click Pie for an alternative graphic display.

Donations tiles can also be configured by clicking the settings cog button.

The Goal dropdown list lets you select from the currently available donation campaigns.

To add a new fundraising campaign to the list, go to Administration and add a new Donation (Gift) type Product. For more information, see Listing Products For Sale in Setting Up Sales. Here is a quick summary:
Add a new Product and select the Type as Donation (Gift).

Fill in the Target and Notes fields, as these will be used by the Monitor chart.

Once saved, the new fundraising campaign will be available in the list of Goal options in Monitor donation tiles.

You can see where the Target and Notes fields have been used:

Arranging Tiles
You can add additional tiles by clicking the Add widget button below the existing tiles.

You will be given the option of a Donations or Production widget. Once you have made your selection, configure the new tile using the settings options described above.

The position and size of the tiles are configurable. Vertical columns are used to align the tiles. To add some column widths to the display, click the + button at the right edge of the screen to add a new column.
To remove an unneeded column, hover the mouse over the column to reveal an x button that will delete the column.

To change the width of a tile to expand it into available column space, or to shrink it narrower to make more space available, grab the resize handle in the bottom-right corner of the tile and drag it. The tile will ‘snap’ to the nearest column width, you do not need to be precise in your resizing.

Move the mouse pointer near the top of a tile, and the pointer will change to a reposition pointer. Click and drag the tile into a new position. You can move the tile across to use up blank column space, or drag it over other tiles, and they will automatically reposition themselves on the screen.

Pin Live Tiles to Main Screen
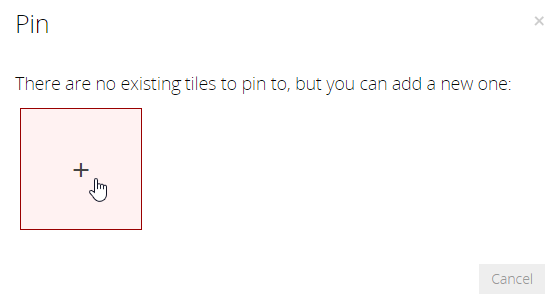
So far, we have considered how we can use the static monitor tile to open a view displaying information about donations and productions. However, you can also add live tiles to the main screen by pinning them. To add a live tile to the main screen, click the pin button in the top right corner of a tile on the Monitor screen.

If there are no live tiles currently displayed, you can add a new one by clicking the + button.
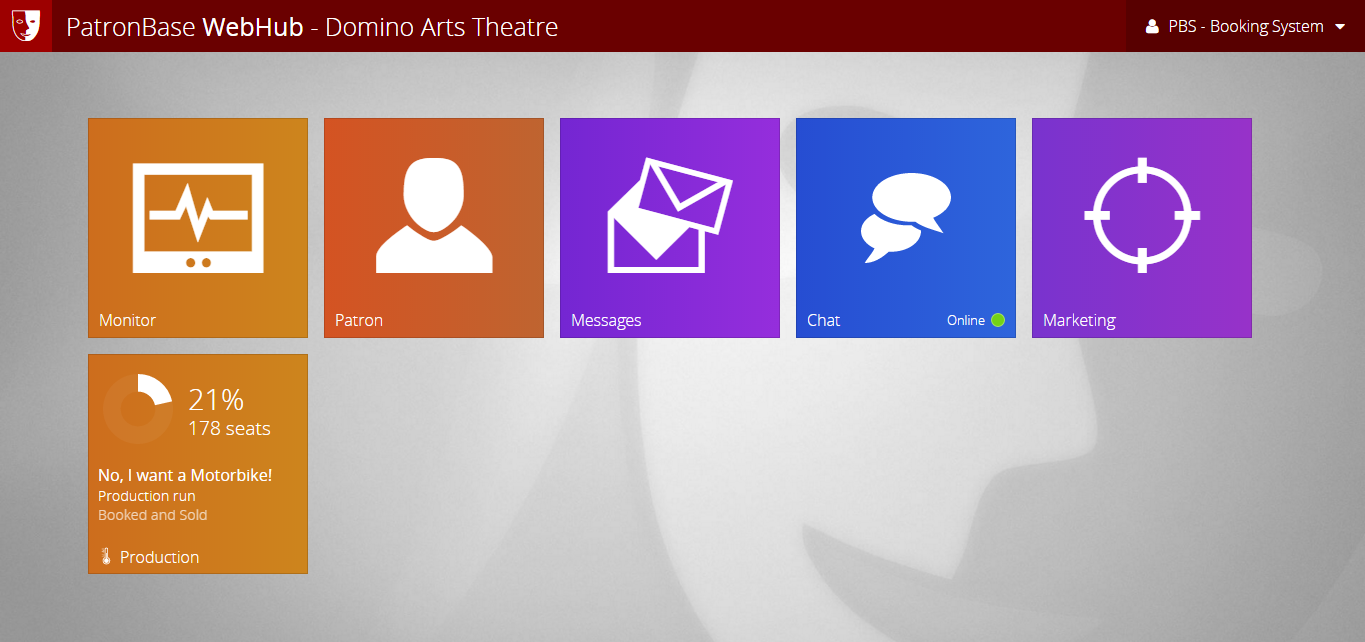
You will not see a change to the Monitor screen, but if you return to the main screen you will see that a new live tile has been added to WebHub, showing a graph and statistics for the item you pinned.
When you pin a production or donation and there is already at least one live tile on the WebHub main screen, you can choose to add a new tile, or pin the data to an existing monitor tile. Choosing to add the data to an existing tile will result in that live tile cycling through the selected statistics, pausing on each for a few seconds.

Once you have added several live monitor tiles, you will probably want to rearrange them. Select Preferences from the menu in the top-right corner of the main WebHub screen.

Select between the options using the checkboxes, as described in Setting WebHub Preferences, and reposition the tiles as you prefer.

Because you can have as many tiles as you want, and because the WebHub layout is so customisable, you can use this feature to create an information radiator for your office. Attach a large flat-panel TV as a second screen to an office PC, and use it to show a screen full of live tiles. The entire office will be able to keep up-to-date with the latest information on production sales and donation campaigns at a glance.
